Learn Stock Trading:
curve fitting - why is it a problem?
Let me begin by saying that curve fitting is the evil nemesis of system traders. It takes a little while to fully appreciate just how deep a problem this is, but let me try to explain from a mathematical perspective.
Want to Learn Stock Trading Quickly...
If you want to learn stock trading and have someone guide you every step of the way so that you can stay in control and learn how to profit quickly then check out my unique new program by clicking the image on the right.
I would love to help you learn stock trading quickly and address your trading questions for you!
Click the image and enter your email to find out more about this unique new program which allows you to learn stock trading quickly with the support you need.
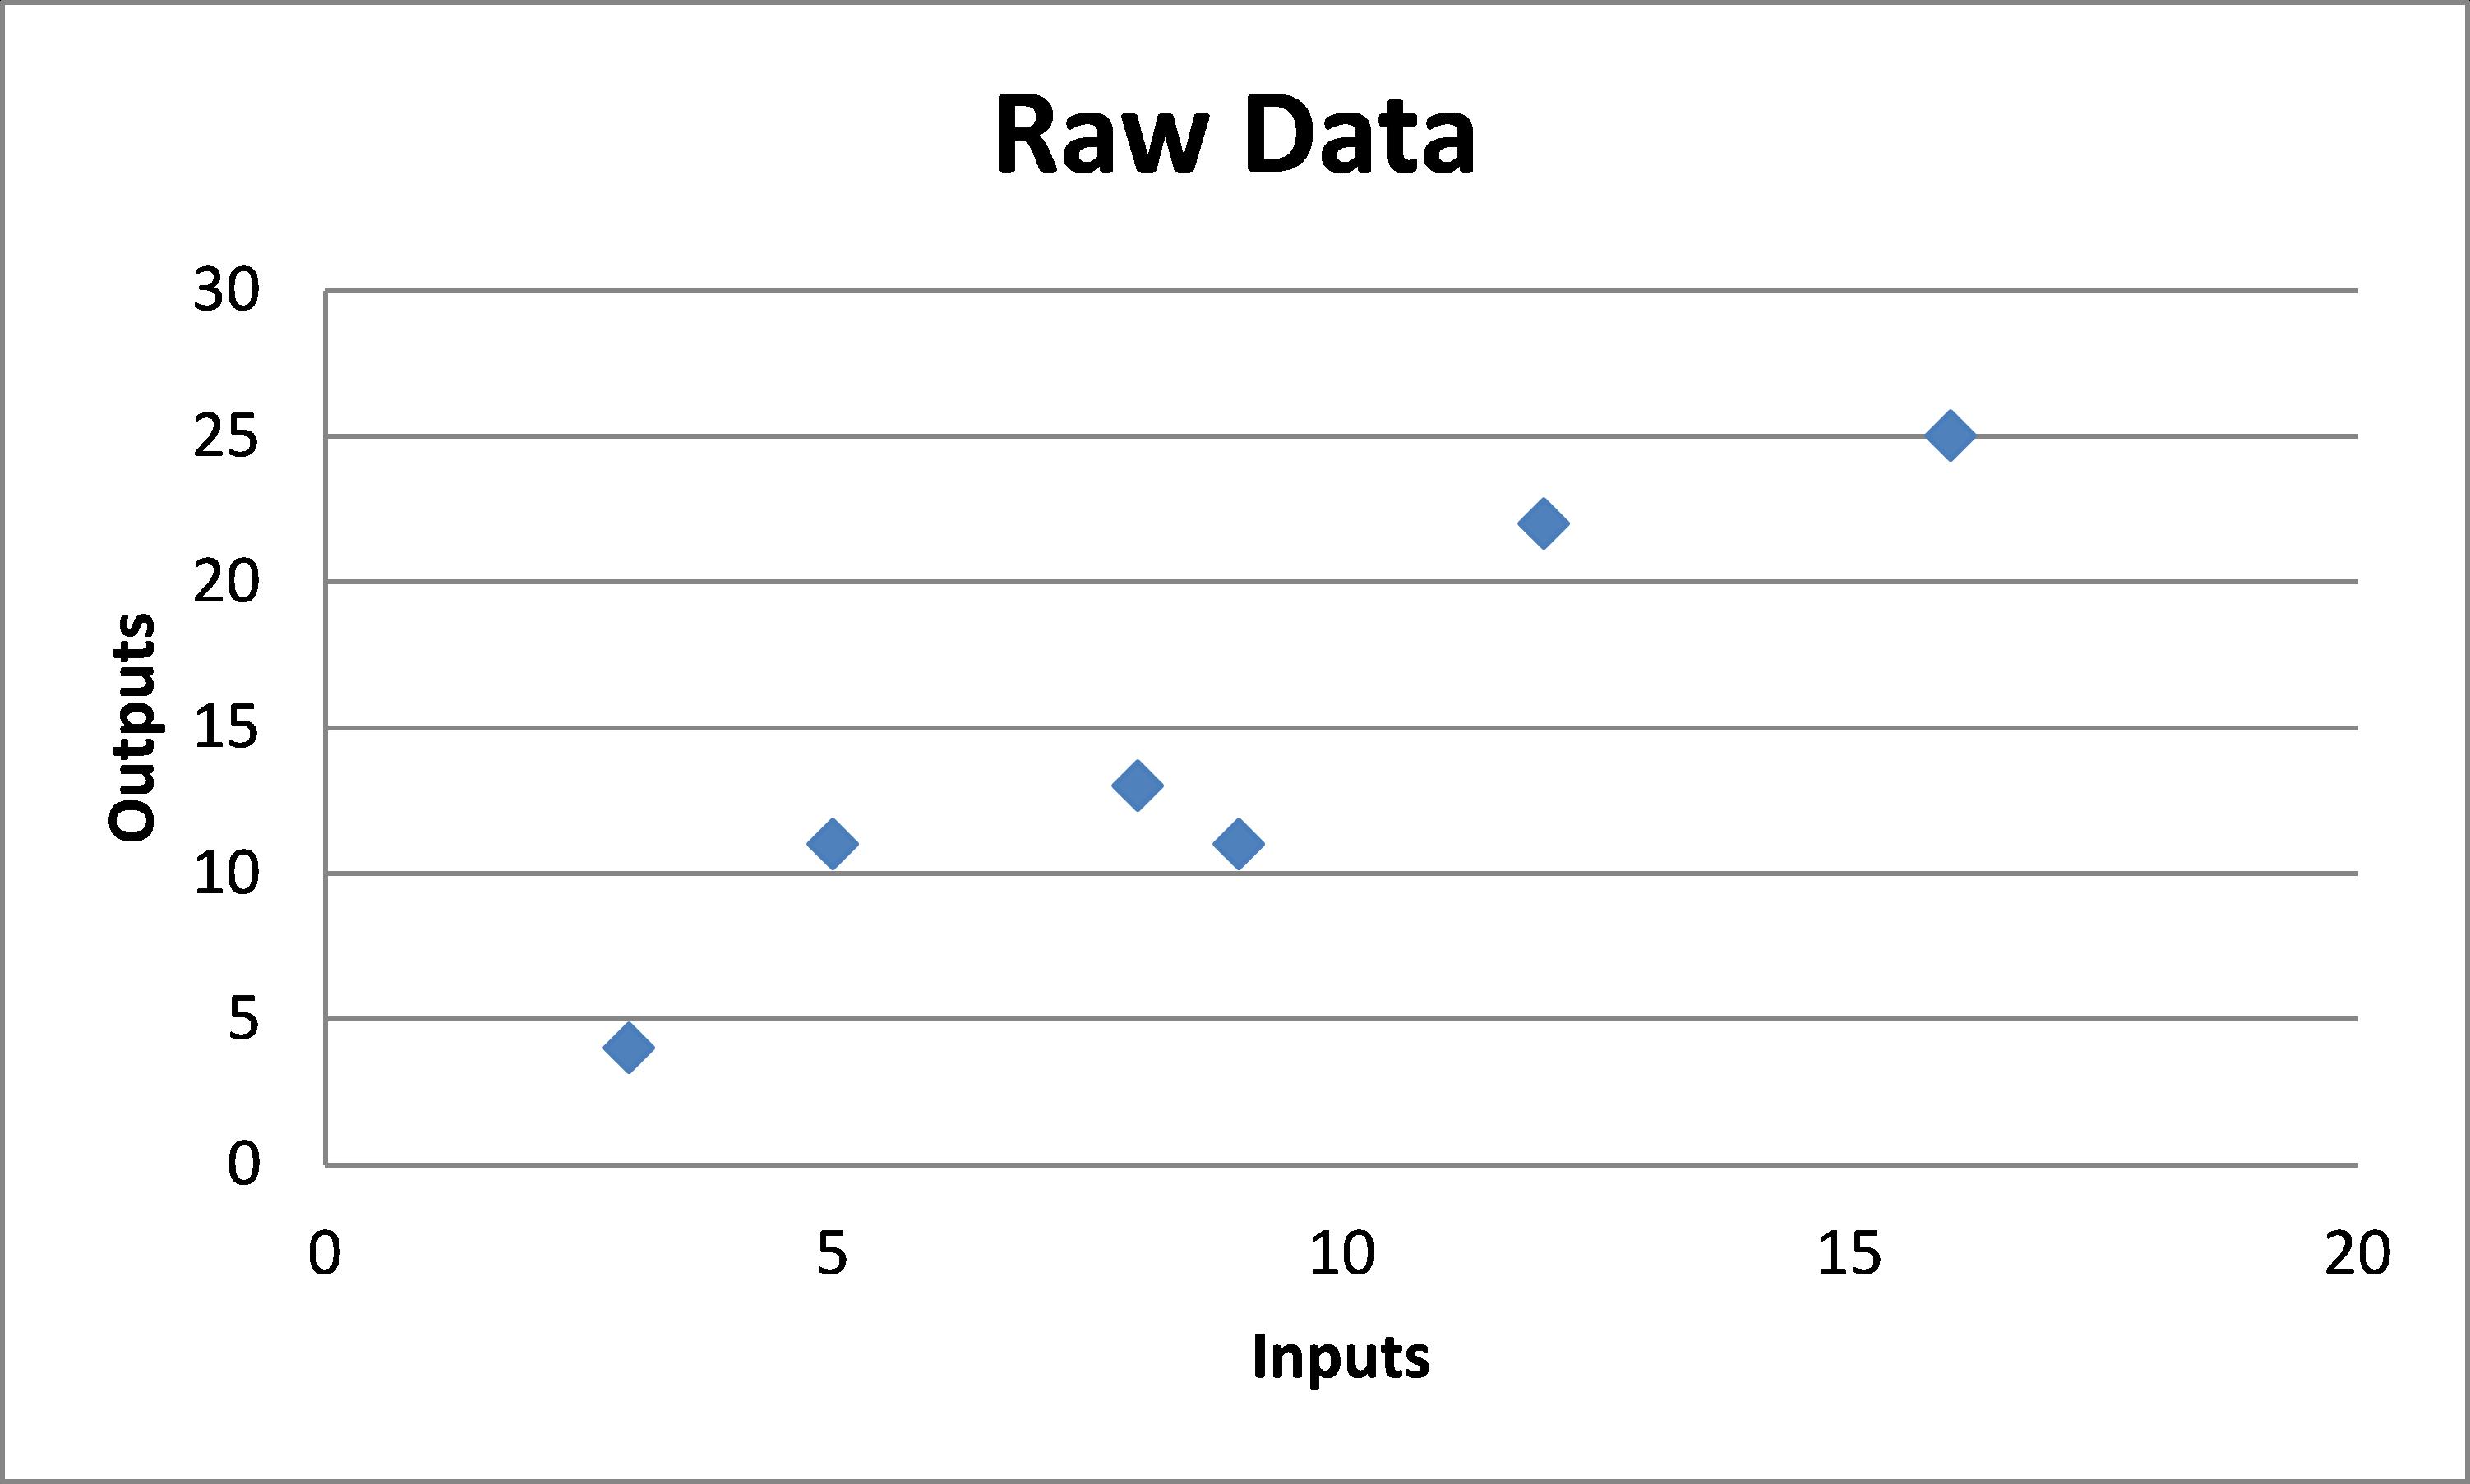
In maths we can use an equation to ‘fit’ a line to a series of data. This is an attempt to explain the data and predict what the output will be for a given input. For example, the following data could be approximated using several different types of equations…
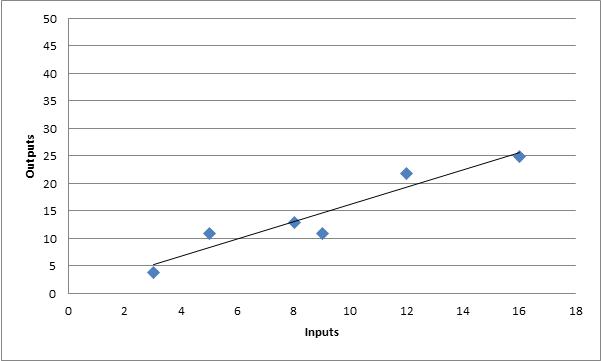
The simplest equation that could be used to describe the raw data is a straight line… it doesn’t fit all the points exactly, but it is a fairly good solution.
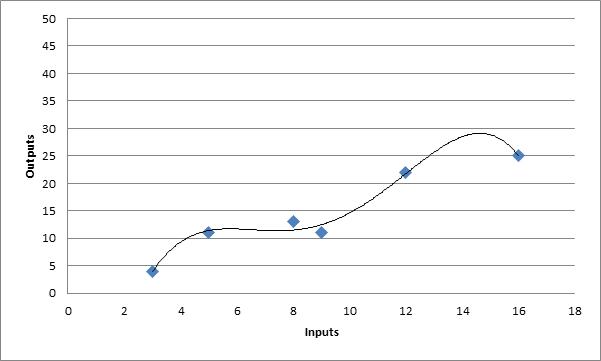
However, if you decided you were not satisfied that the line did not fit the data exactly, you could use a moderate equation to fit the line to the data… this still does not fit all the points exactly, but looks to be a better fit to the data.
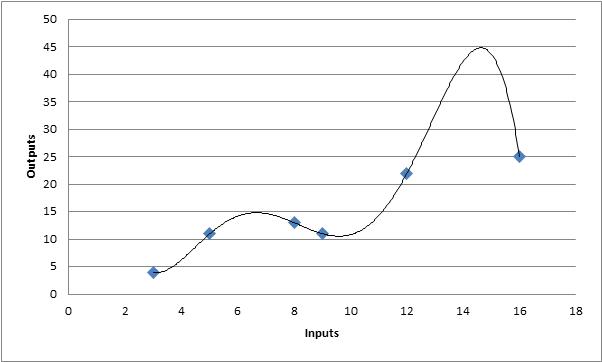
If you take a more extreme position you can devise a complex equation that fits all of the data points exactly and represents curve fitting.
Moving from top to bottom above we have progressively created more complex equations in an attempt to describe the data. So in the last image, the data is described exactly by the equation. However, the last image is nowhere near as useful as the simple equation shown in the first image because whilst it fits the data points exactly, it will be hopeless at predicting future data based on new inputs. For example, if you used the last equation to predict what the output would be for an input of 20, the answer would be some extreme value that has no resemblance to the existing data set. If you used the simple equation at the top to predict the output for an input value of 20 then you would get a sensible answer that is consistent with the data we already have.
Fitting a curve to experimental data exactly rarely, if ever, gives you the correct relationships because there is always noise in the data. It is far more useful to think logically about what the relationship should be and then fit an equation to the data using that logical relationship.
Now let’s apply this to trading…
When we design a trading system we devise a set of rules that determines when we want to enter and exit trades. If we code these rules and test them on historical data then we can evaluate how well our system would have worked in the past.
What we typically do after designing our initial set of rules is try to find ways to improve the system by changing or adding rules. We then retest the adjusted system on the historical data and determine how much better the new rules are.
Where traders run into trouble is when they become too focused on getting the best performance figures from the historical data by adding lots of specific rules to their trading system. When there are too many rules that are specific to the period of time covered by the historical data, the system looks very good when you run it over the past data, but when you trade it in real time with new data it has no predictive power (like the last chart above) and it loses money.
As an extreme example (for illustrative purposes), let’s say we are testing our system and we discover that we could avoid some big losses in the past if we exit all of our positions on the last day in September. There is no logical basis for this rule, but in the past data there was a market crash in October which led to the market falling by 30% overnight (this is a hypothetical example). So your testing shows a dramatic improvement by introducing the ‘September Exit’ rule. You think you are a champion trader because your historical testing shows fantastic performance figures, but when you trade this system in real time in the future you will be exiting your trades in September for no rational reason…and performance will very likely be terrible as a result.
conclusion on curve fitting:
Curve fitting is evil – traders need simple and logical rules, we also need a small number of rules in order for a trading system to work in real time. We can test how curve fit our system is by testing it on different sets of data. For example, you designed your trading system using Australian stock data and tested the system on US stock data as your ‘out of sample’ test. If your system is curve fit too much to the Australian data then the US performance will be much worse than the Australian historical test. But, if the system you designed is robust and simple with a real market edge then it should still work on the US data.
Want to Learn Stock Trading Quickly...
If you want to learn stock trading and have someone guide you every step of the way so that you can stay in control and learn how to profit quickly then check out my unique new program by clicking the image on the right.
I would love to help you learn stock trading quickly and address your trading questions for you!
Click the image and enter your email to find out more about this unique new program which allows you to learn stock trading quickly with the support you need.
Return to top of Curve Fitting
Return to Learn Stock Trading
Related Articles:
Main Learn Stock Trading Page: Learn Stock Trading: Get your trading questions answered!
- The stock market is correcting, should I put a stop loss?
- What is curve fitting and why is it a problem?
- Why is too much leverage dangerous?
- When I use end of day data can I trade all time frames with it?
- Is end of day data reliable?
- What is a realistic trading profit target?
- Using Metastock stock market data with Trading Blox
- How much capital should I have at risk in the stock market at any one time?
- What are reasonable CAGR and Drawdown Targets?
- Position sizing the right way
- Risk Management and Position Sizing to Avoid Blowup
Return to top of What is curve fitting and why is it a problem?
Return to Home Page
Looking for something else - Find it on the Sitemap


