Trading Signal Beliefs - Example System
This page provides an example of how one might translate each of their beliefs into a trading signal which they could then use in trading system development.
Example Beliefs:
- You believe that markets trend and the best way to profit is to identify a low risk entry point in an established, low volatility trend and enter
- You believe that you can generate good profits if you give trades a lot of room to move and grow
- You believe that a small number of trades will generate monster profits and these will more than offset all of the small losses you have along the way
- You believe that a 'low risk entry point' is when there has been a moderate pullback from the trend and price has again started moving in the direction of the trend
Example trading signals based on this set of beliefs:
- Setup: Establish the existence of a trend by only taking trades where the close is greater than the 50 day moving average which is greater than the 200 day moving average. Select only low volatility trends by requiring that the Average True Range is less than 3% of the stock price
- Entry Trigger: Enter when the price closes below and then rises back above the 10 day MA indicating that the trend has resumed
- Initial stop loss: Set the 10 day low as the initial stop loss as this is the logical point on the chart that, if violated, would indicate that your were wrong and you should exit.
- Exits: Use a trailing stop based on the volatility of the stock which gives the trade lots of room to move. For example use a 6ATR trailing stop (link to chart example for explanation and formula if required)
- Position sizing: This system will likely have about 30% winners and 70% losers and will also have many trades open at a time. Risk a small proportion of equity on each trade to minimise drawdown but still give sufficient profits when you get a winning trade. Try risking 0.5% of the account on each trade
Hypothetical Equity Curve
Now this example was just made up in 5 minutes based on the beliefs written above. Lets see how it looks when simulated on past data (note that there has been no optimisation, no curve fitting, no data mining here - the entire trading system has been defined purely from a set of beliefs that we documented and then converted to mathematical logic.
Simulation Parameters:
- Portfolio: Australian Fully Paid Ordinary shares
- Starting Equity: $100,000
- Risk: 0.5% per trade
- Margin Requirement: 100% (i.e. no leverage)
- Brokerage: $20 per side
- Slippage: Ignored
- Start Date: 1 January 1992
- End Date: 24 October 2013
Note: This is a hypothetical equity curve based on historical data only. It is not an endorsement or recommendation.
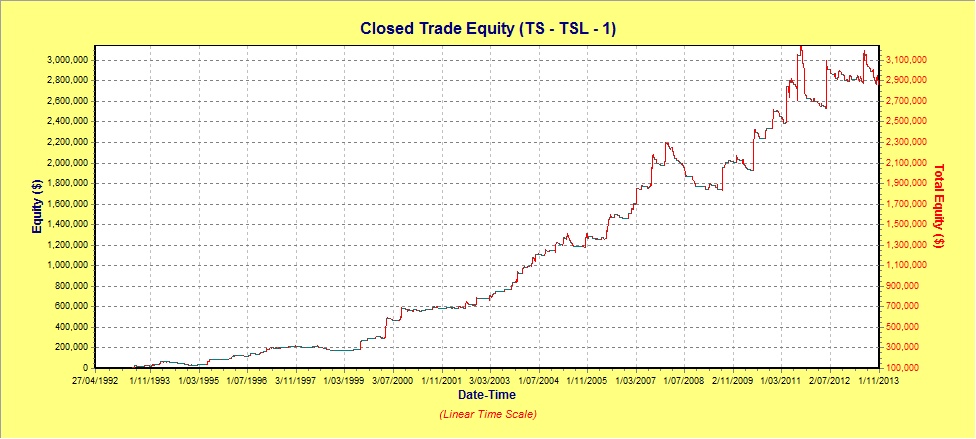
While it is obviously far too early to evaluate the viability of the trading signals and the resulting system outlined above, the simulated equity curve above is promising. Especially considering there has been no optimisation and the simulation includes the global financial crisis period post 2008!
This demonstrates the power of documenting your beliefs about each component of the trading system before tinkering with trading rules. It gives you a solid base to work from and dramatically reduces the time to design and test a trading system.
Related Articles:
Main Page: What are stock trading systems and how do they work?
- Trading System Development - The Right Way
- Mechanical trading systems save you from yourself!
- What makes a good trading system?
- Choosing the best trading system
- Trend Following System Components
- Penny Stock Trading Systems - Benefits and Pitfalls
- Trading Signal Beliefs - Example System
- Should I consider paper trading before using real money?
Return to top of Trading Signal
Return to Trading Signals main page
Return to Home Page
Looking for something else - Find it on the Sitemap

